


Current Activities
-
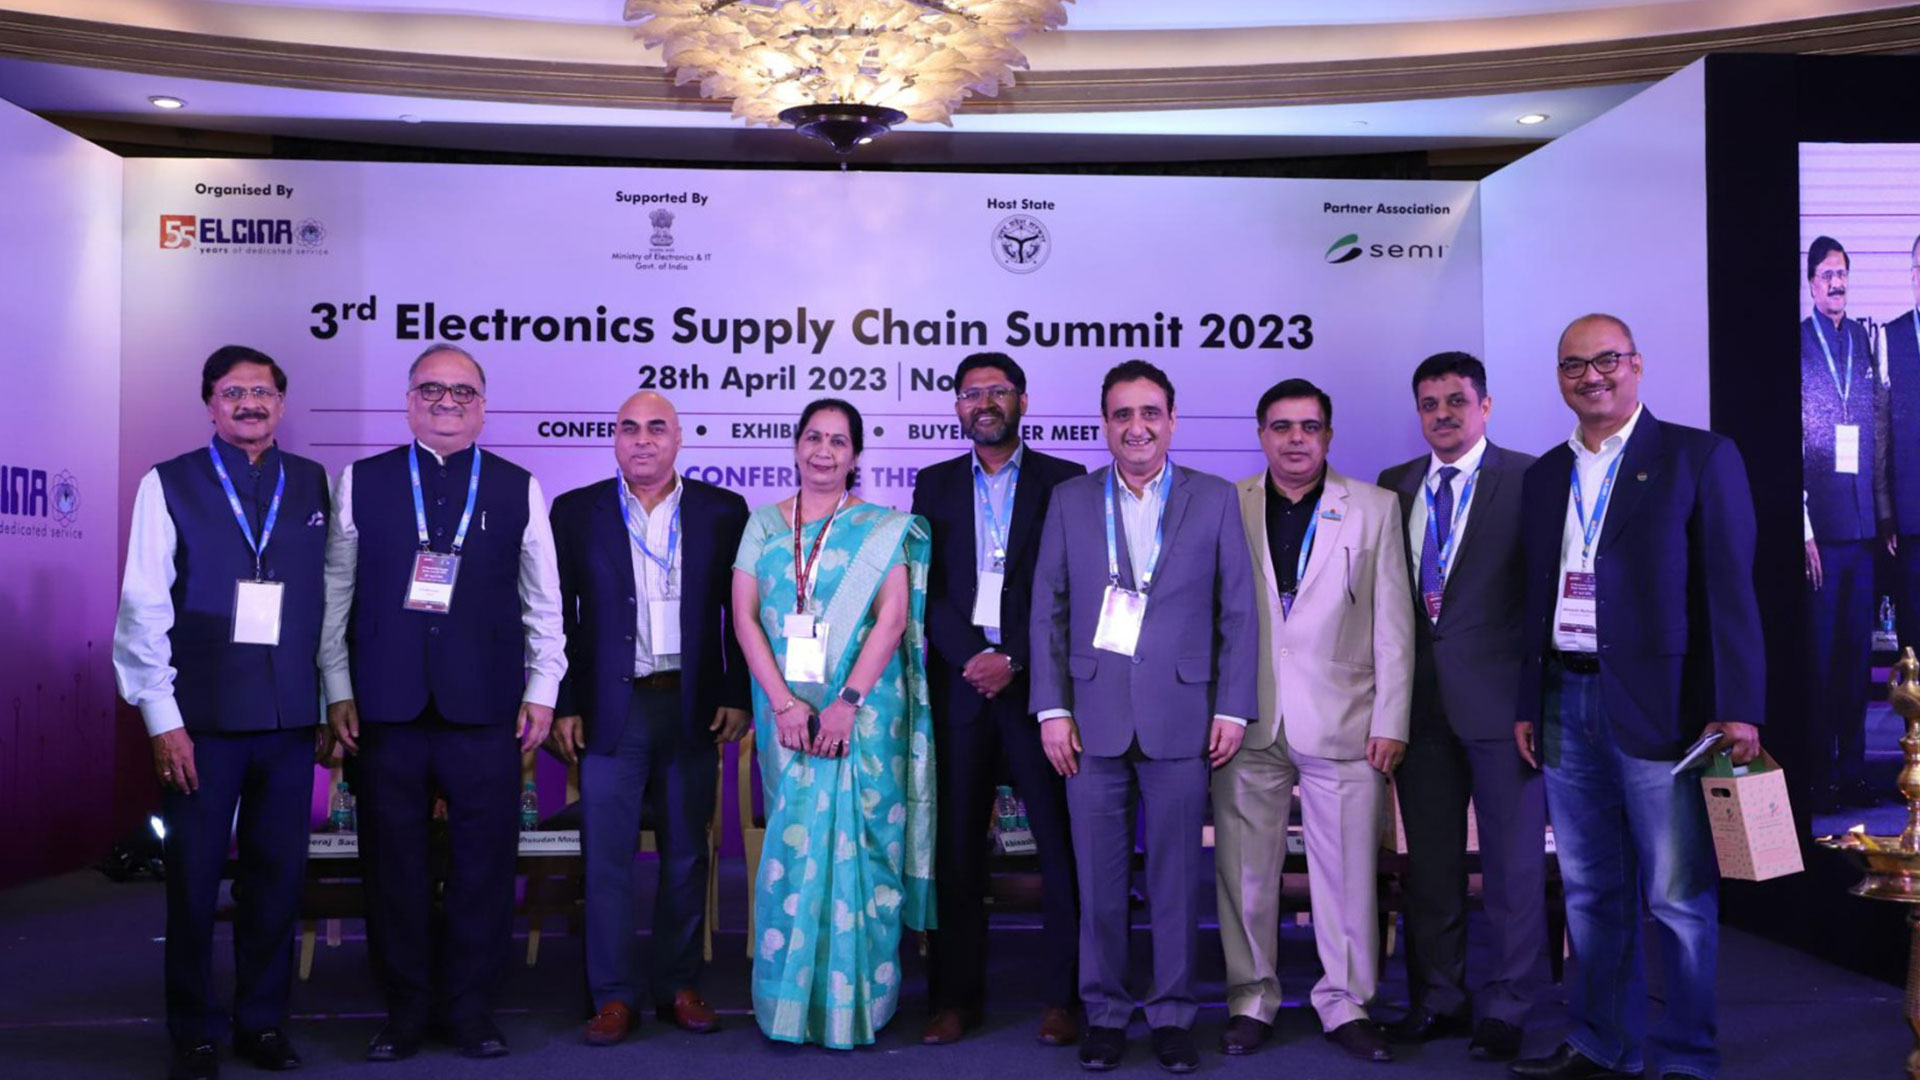
4th Electronics Supply Chain Summit
8th May 2024, Noida -
4th Electronics Supply Chain Summit (For Security & Surveillance Industry)
9th May 2024, Noida -
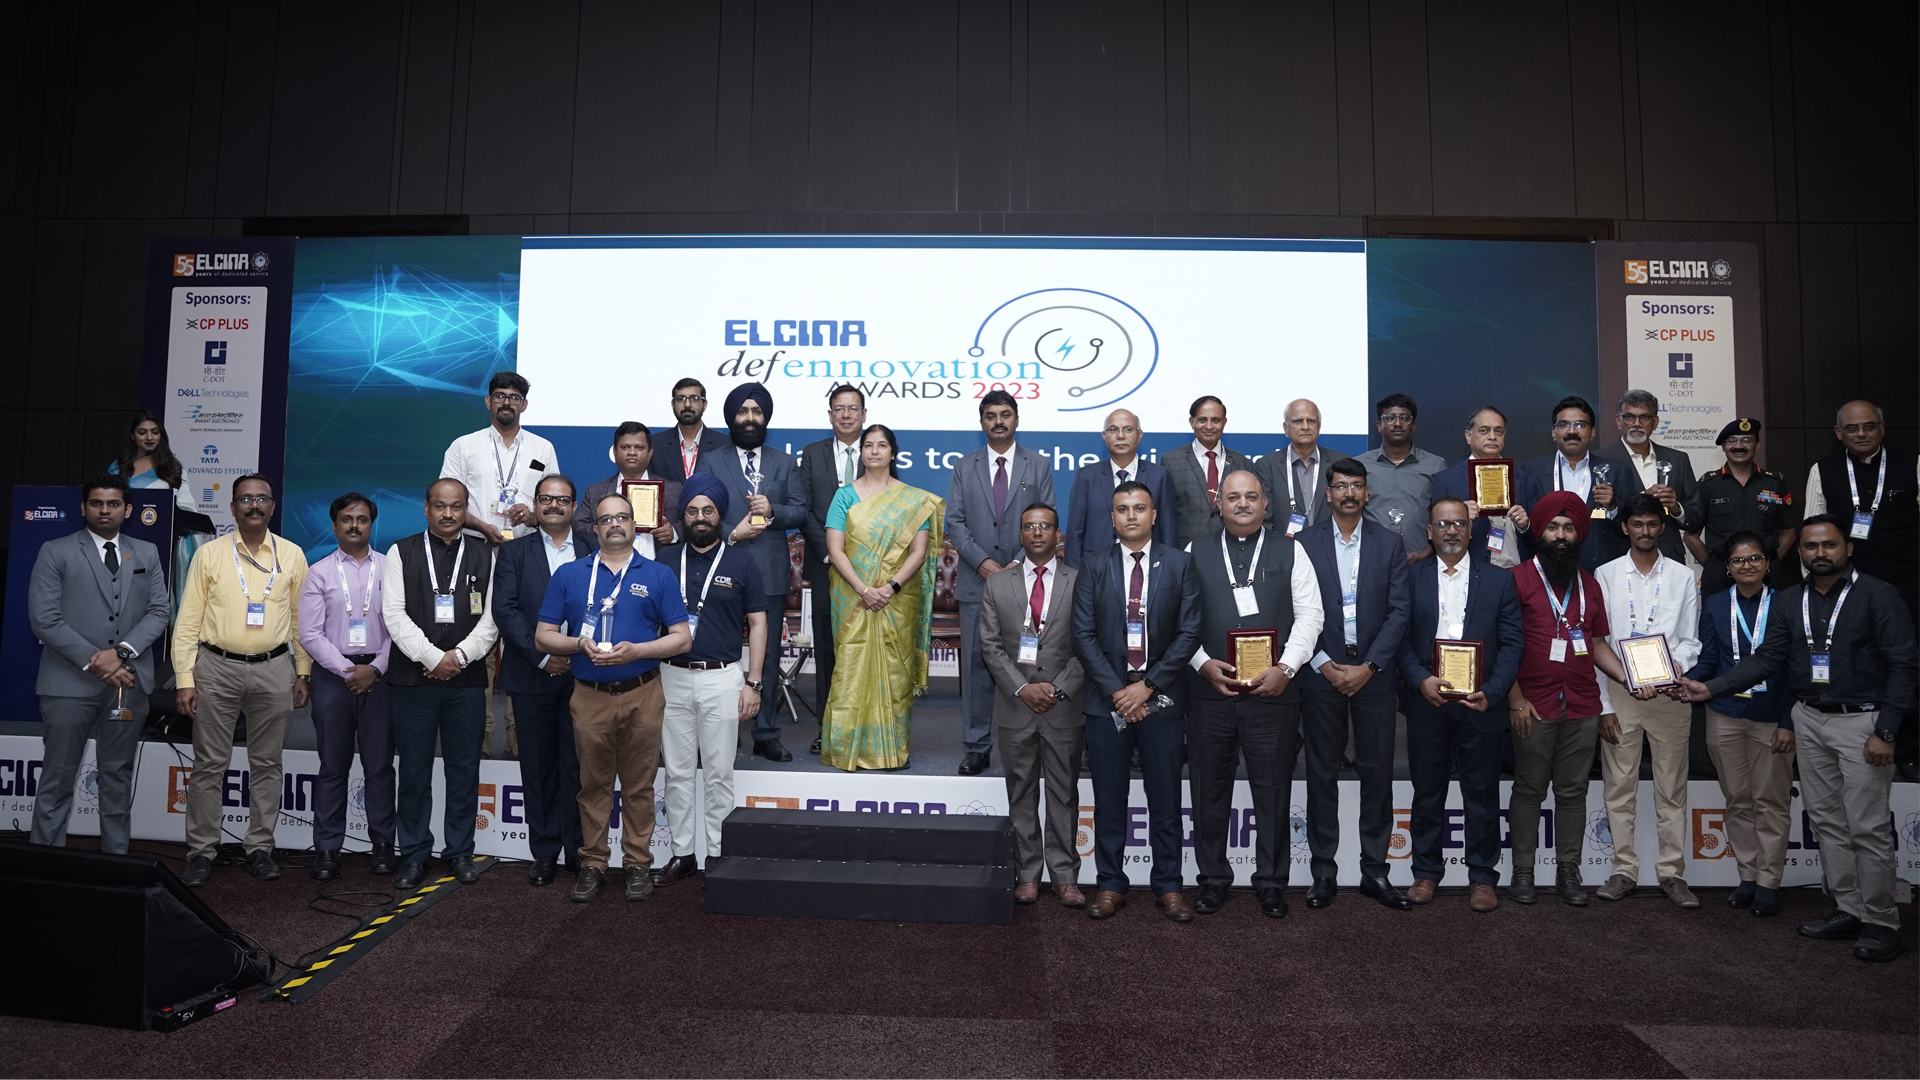
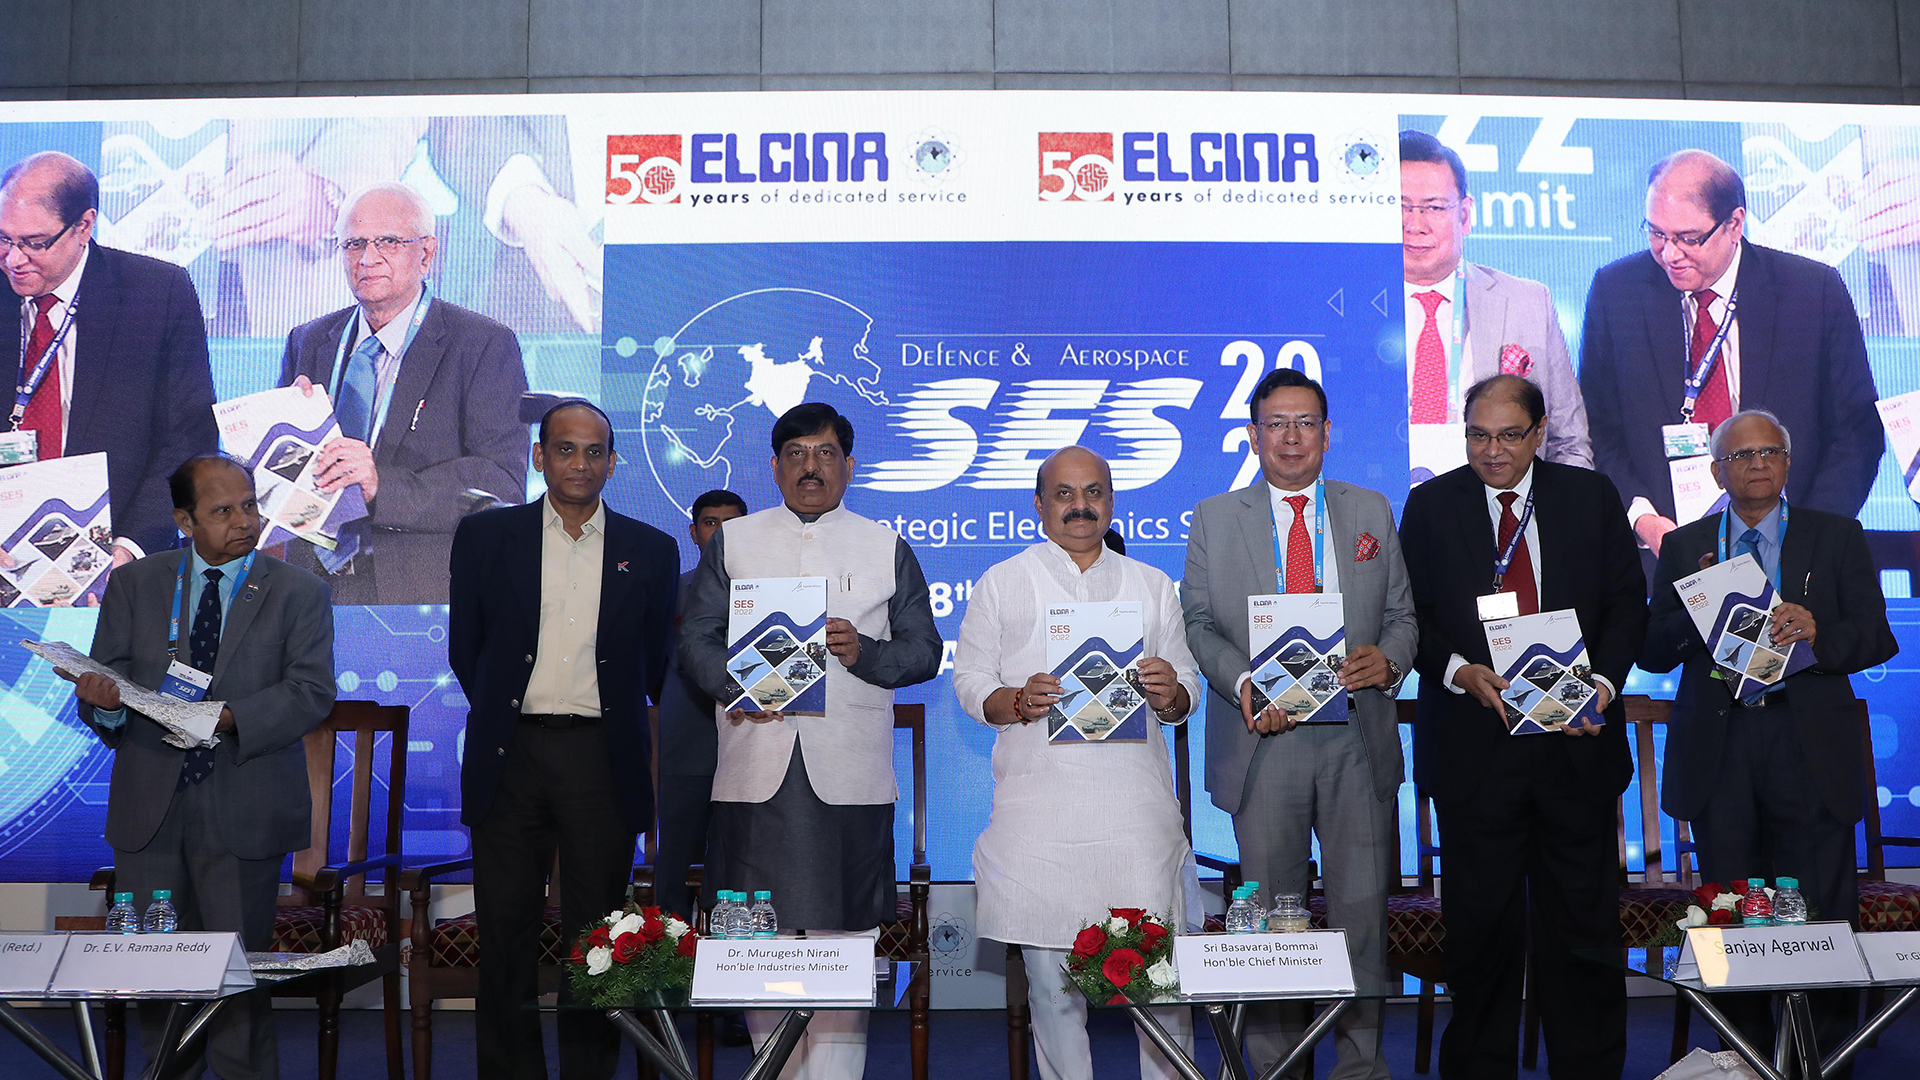
13th Strategic Electronics Summit
17th & 18th July 2024, Bengaluru -
Taiwan Expo
8th to 10th July 2024 -
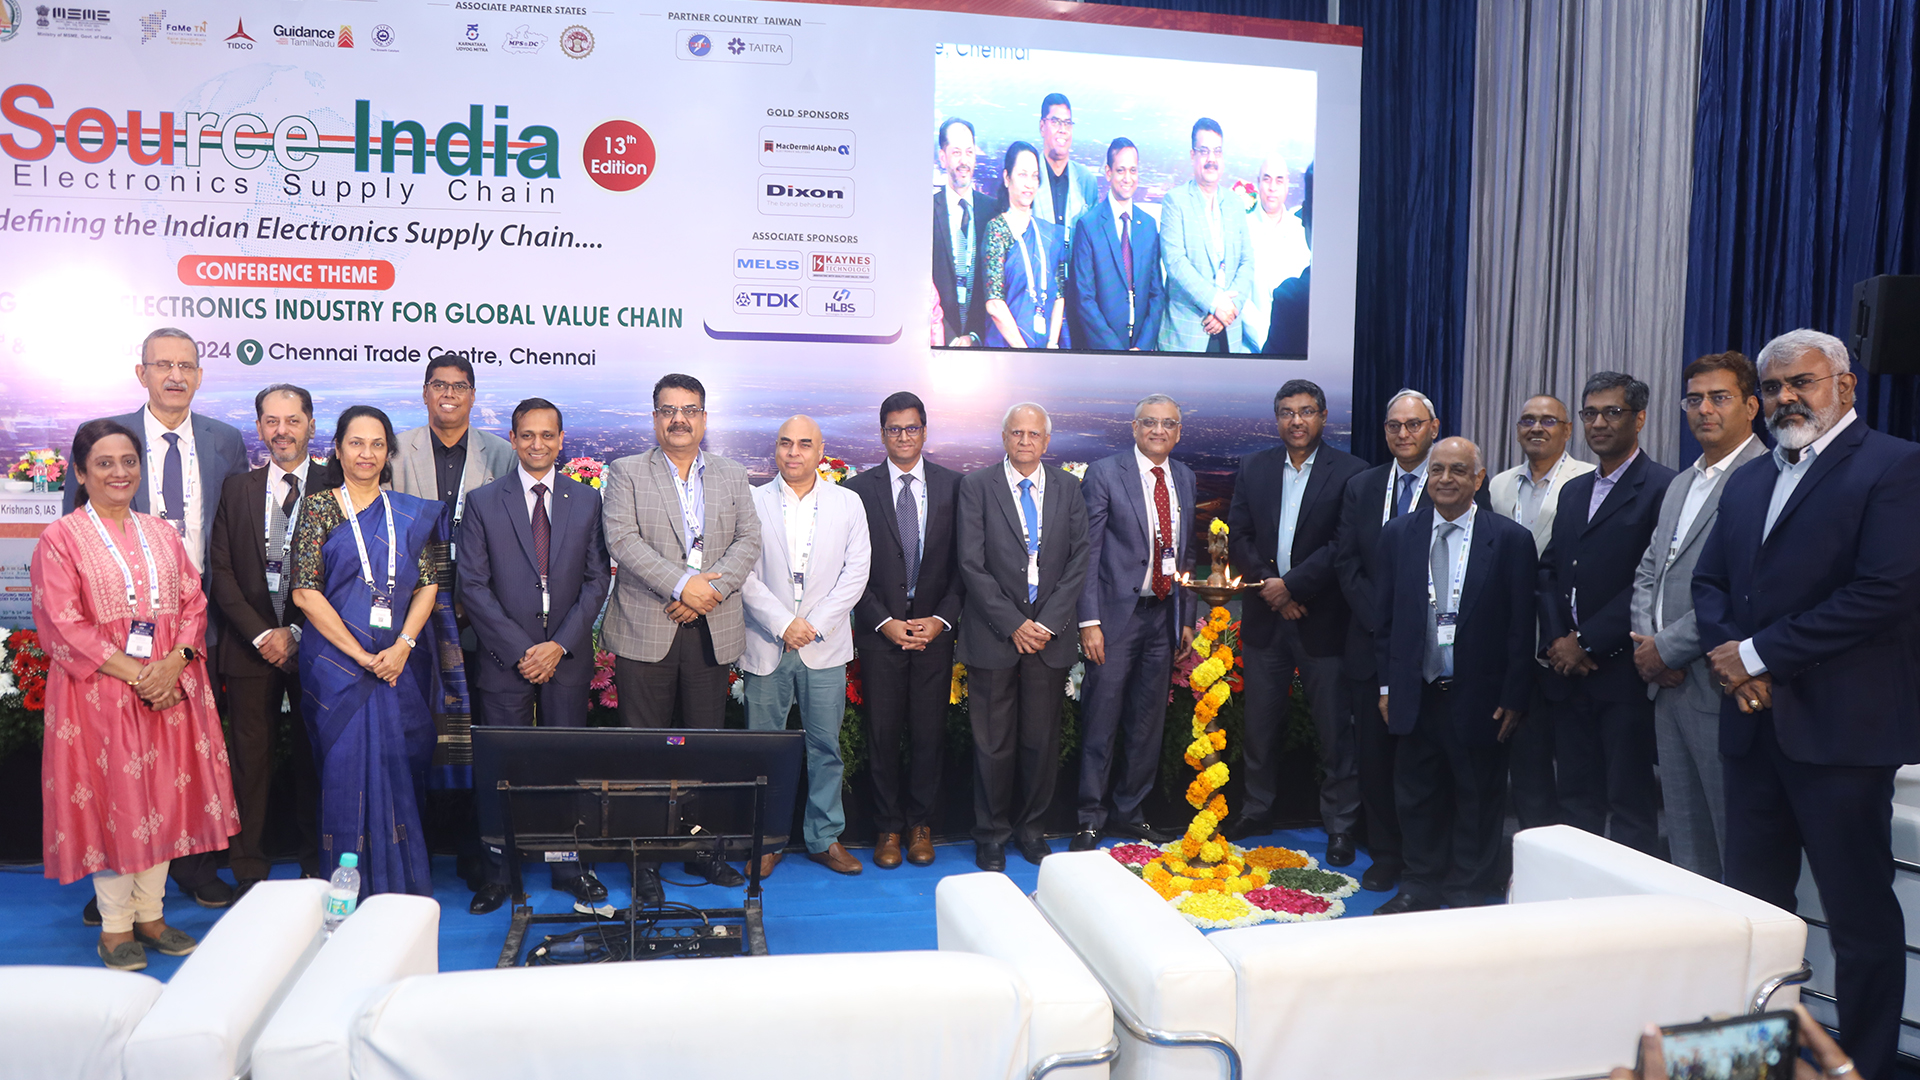
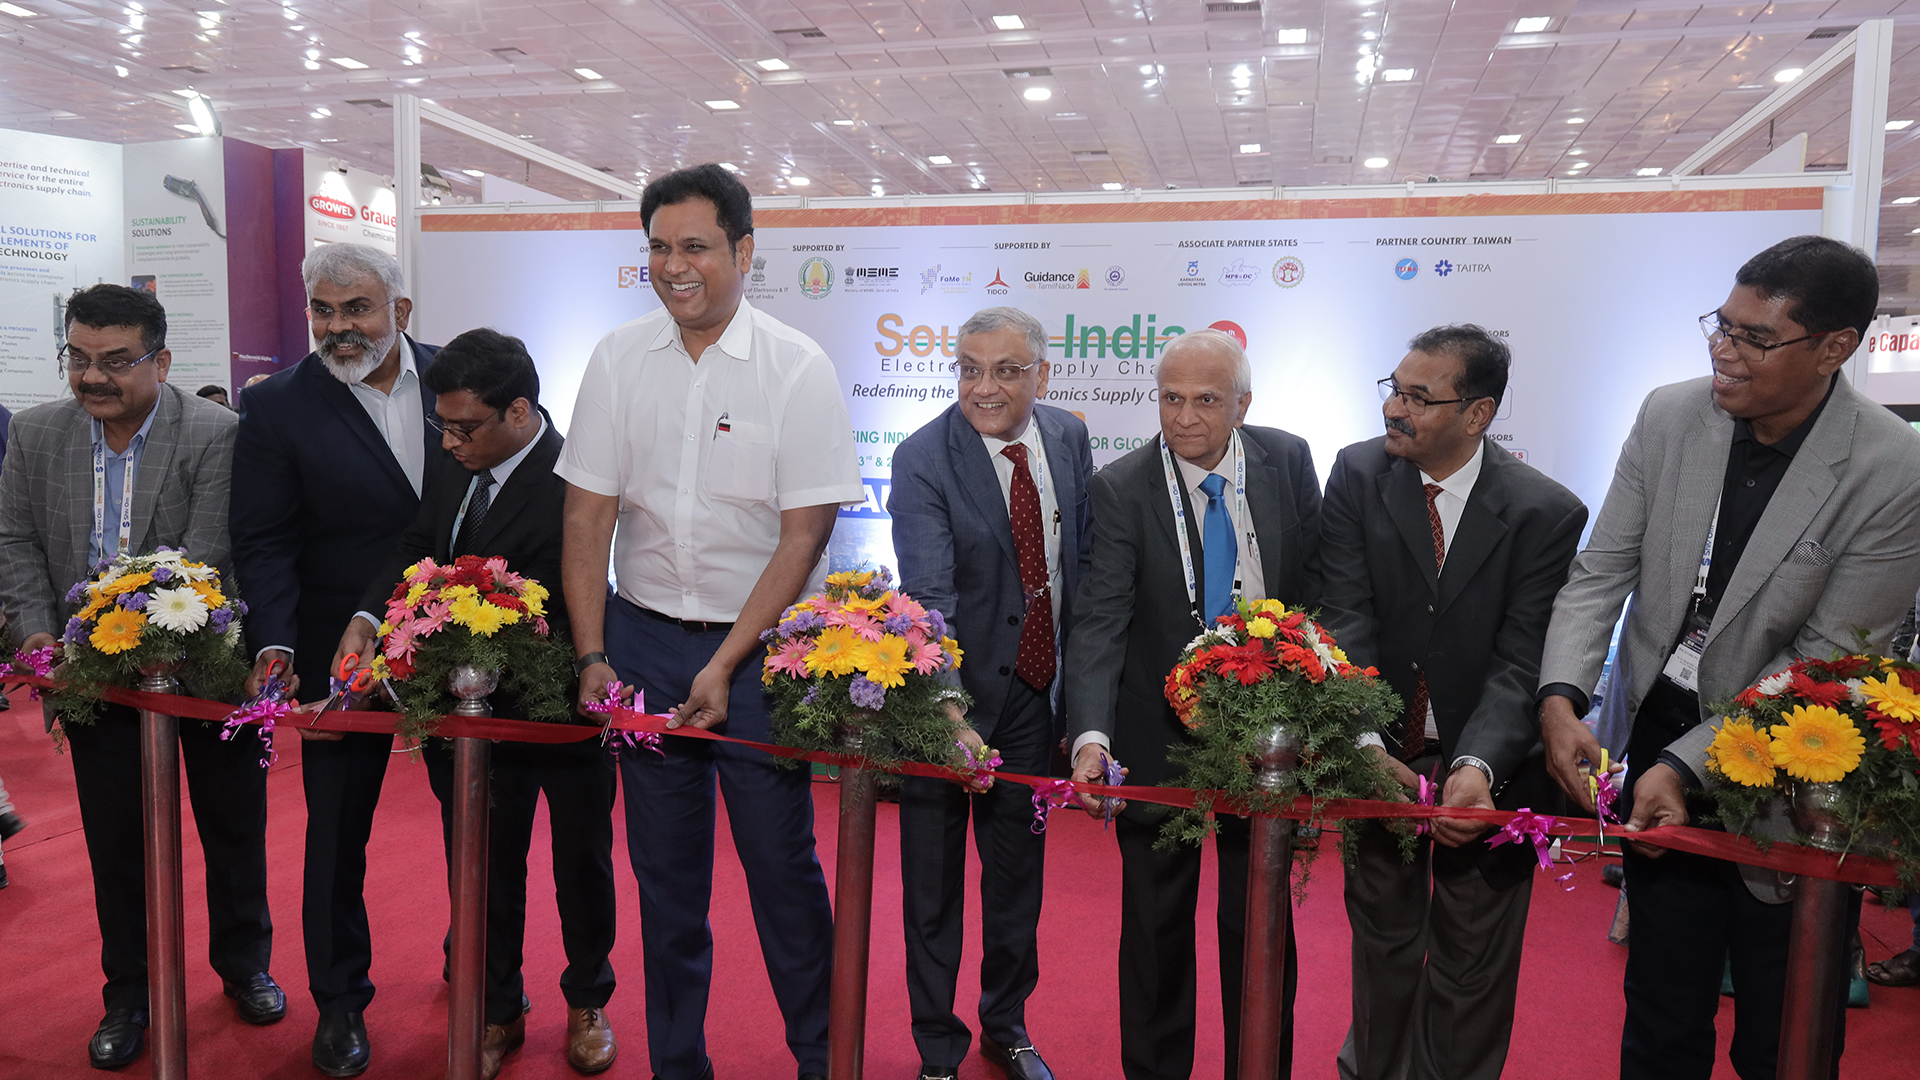
14th Source India – Electronics Supply Chain
18th & 19th February 2025